Designed for continuous outdoor deployment across real-world environments.
Persium Case Study
Westminster, UK 🇬🇧
Integrating air quality intelligence into the Westminster Health Index.
Westminster, UK 🇬🇧
Persium Case Study
Integrating air quality intelligence into the Westminster Health Index.
Westminster, UK 🇬🇧
Persium Case Study
Integrating air quality intelligence into the Westminster Health Index.
Project Summary
Persium deployed a borough-wide air quality monitoring network across Westminster to support the Westminster Health Index and inform evidence-based policy decisions. Sensors are positioned across parks, high-traffic roads, council estates, and residential neighbourhoods, providing hyperlocal visibility into how pollution exposure varies between communities. Environmental data feeds directly into the Health Index alongside hospital admissions, school performance, and socio-economic indicators.
The Challenge
Air pollution is not experienced equally across Westminster. Exposure varies significantly between affluent wards and more vulnerable communities, and those differences contribute directly to health disparities across the borough. Understanding where exposure is highest, and who is most affected, requires monitoring at the resolution of streets and neighbourhoods, not borough-wide averages.
Persium Deployment
Monitoring through MapView
All data streams into Persium's Dashboard and MapView, giving Westminster a live, geospatial picture of air quality conditions across the borough. The platform enables trend analysis, hotspot identification, and real-time comparison across monitoring locations.
Environmental data integrates with the Westminster Health Index, connecting air quality metrics with:
Hospital admissions
Obesity levels
School performance indicators
Socio-economic data
Air quality becomes part of a broader health system, not a standalone metric.

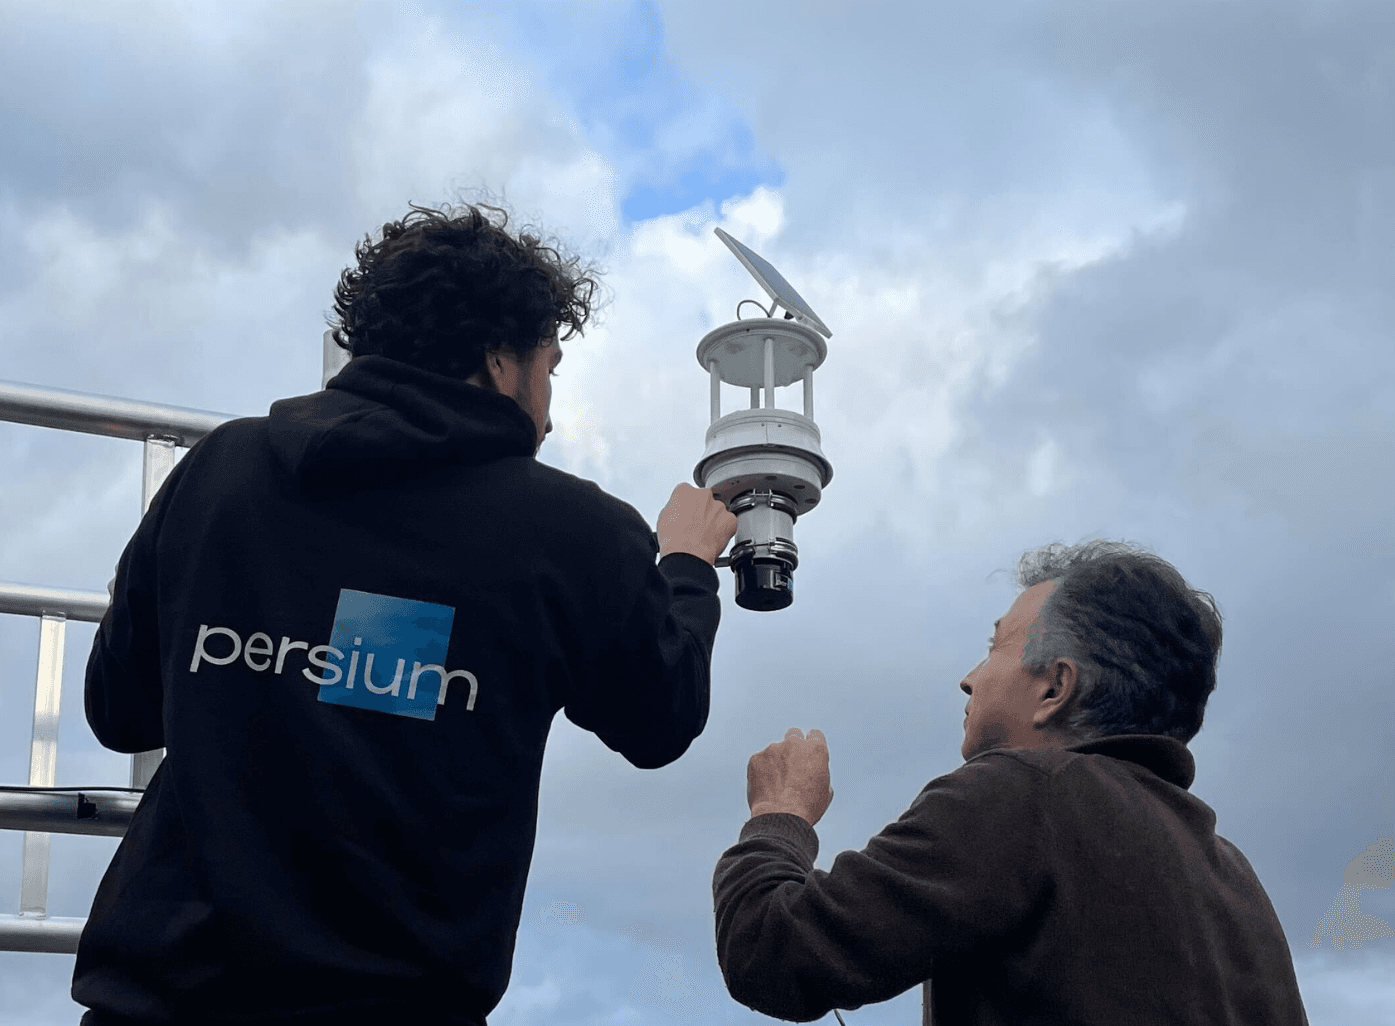
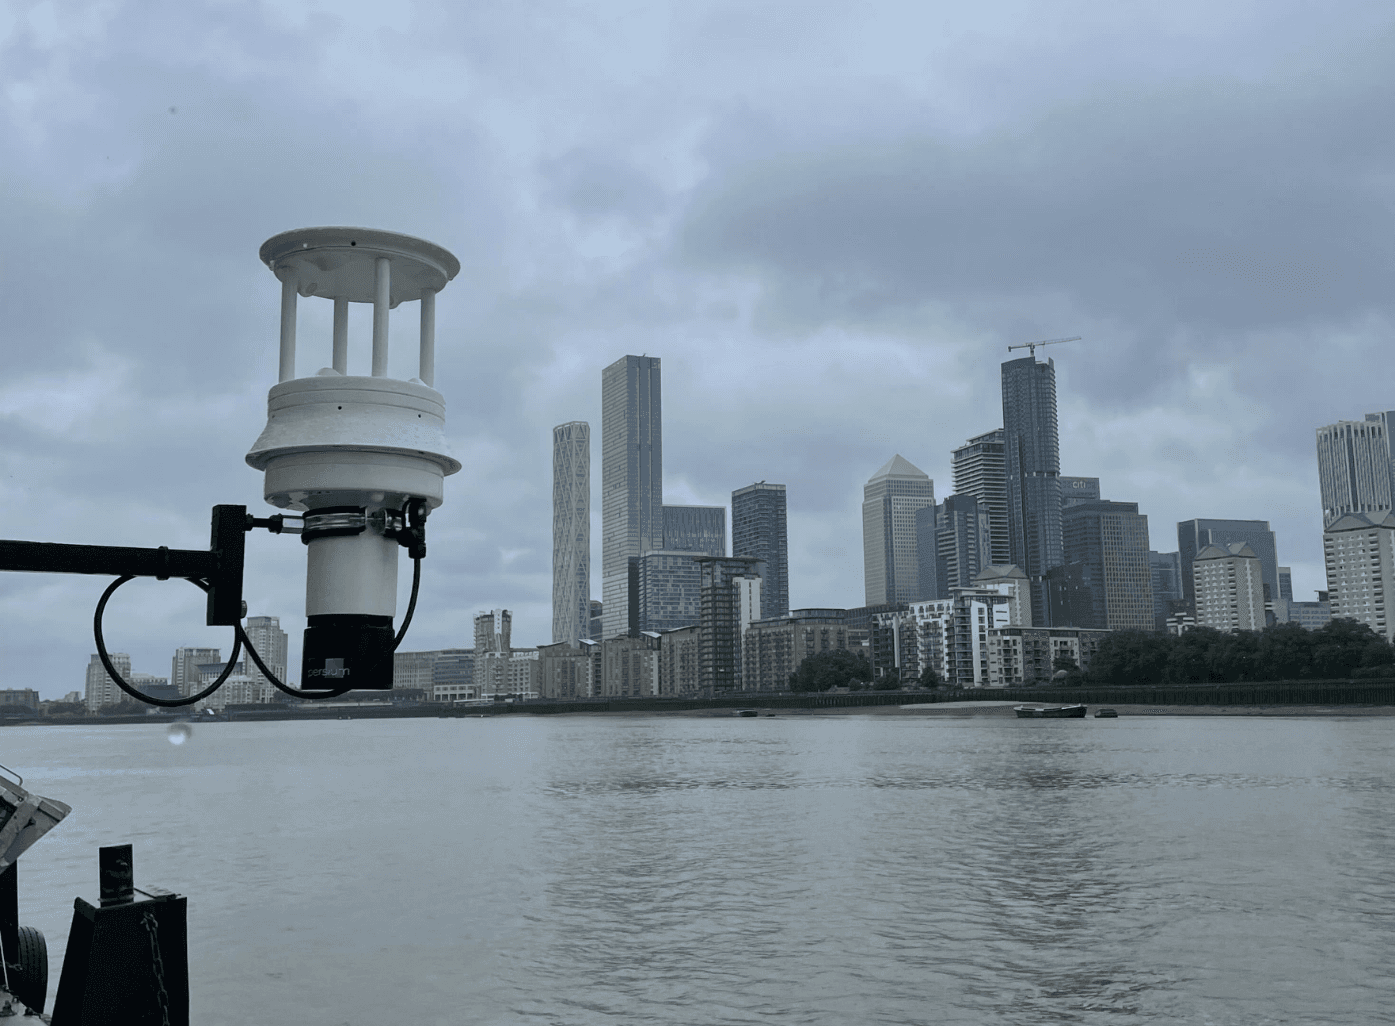
Persium Pods are installed across Westminster, positioned to reflect the diversity of environments experienced by residents across the borough.
Deployment locations include:
Major public parks: Hyde Park, St James's Park, Regent's Park
High-traffic road corridors
Council housing estates
Residential neighbourhoods
Measurements include:
Persium Pods measure a comprehensive range of air quality and environmental parameters, including key pollutants such as NO₂, O₃, CO, SO₂, PM0.3, PM1, PM2.5, and PM10, alongside atmospheric conditions including temperature, humidity, pressure, wind speed and direction, noise, and heat stress indicators. Exact configuration is tailored to the requirements of each deployment.
What This Enables
Real-time, hyperlocal monitoring gives Westminster the evidence to move from observation to action, identifying the worst-affected areas, targeting mitigation strategies, evaluating the impact of cleaner transport policies, and modelling the health and economic return on investment of interventions such as electric bus fleets.
Environmental intelligence integrated with public health strategy.
RECAP
Project Summary
Persium deployed a borough-wide air quality monitoring network across Westminster to support the Westminster Health Index and inform evidence-based policy decisions. Sensors are positioned across parks, high-traffic roads, council estates, and residential neighbourhoods, providing hyperlocal visibility into how pollution exposure varies between communities. Environmental data feeds directly into the Health Index alongside hospital admissions, school performance, and socio-economic indicators.
The Challenge
Air pollution is not experienced equally across Westminster. Exposure varies significantly between affluent wards and more vulnerable communities, and those differences contribute directly to health disparities across the borough. Understanding where exposure is highest, and who is most affected, requires monitoring at the resolution of streets and neighbourhoods, not borough-wide averages.
Persium
Deployment
Persium Pods are installed across Westminster, positioned to reflect the diversity of environments experienced by residents across the borough.
Deployment locations include:
Major public parks: Hyde Park, St James's Park, Regent's Park
High-traffic road corridors
Council housing estates
Residential neighbourhoods
Measurements include:
Persium Pods measure a comprehensive range of air quality and environmental parameters, including key pollutants such as NO₂, O₃, CO, SO₂, PM0.3, PM1, PM2.5, and PM10, alongside atmospheric conditions including temperature, humidity, pressure, wind speed and direction, noise, and heat stress indicators. Exact configuration is tailored to the requirements of each deployment.
Monitoring through Dashboard & MapView
All data streams into Persium's Dashboard and MapView, giving Westminster a live, geospatial picture of air quality conditions across the borough. The platform enables trend analysis, hotspot identification, and real-time comparison across monitoring locations.
Environmental data integrates with the Westminster Health Index, connecting air quality metrics with:
Hospital admissions
Obesity levels
School performance indicators
Socio-economic data
Air quality becomes part of a broader health system, not a standalone metric.
What This Enables
Real-time, hyperlocal monitoring gives Westminster the evidence to move from observation to action, identifying the worst-affected areas, targeting mitigation strategies, evaluating the impact of cleaner transport policies, and modelling the health and economic return on investment of interventions such as electric bus fleets.
Environmental intelligence integrated with public health strategy.
Environmental data that connects to the decisions that matter.
Talk to our team about deploying Persium for your local authority.
Environmental data that connects to the decisions that matter.
Talk to our team about deploying Persium for your local authority.