Designed for continuous outdoor deployment across real-world environments.

One platform to visualise, analyse, and act on your environmental data, in real time, across every sensor in your network.
Dashboard
Interactive air quality, noise & environmental data visualisation and analysis
Interactive air quality, noise &
environmental data visualisation and analysis
Digital Twinning
Persium Dashboard
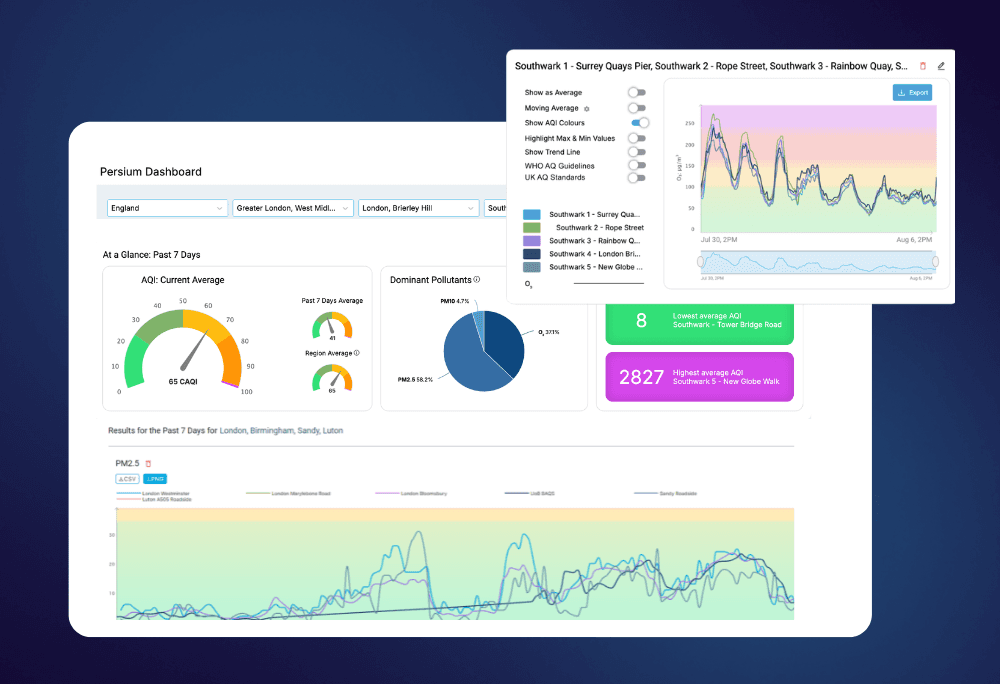
The Persium Dashboard gives cities, operators, and environmental teams a single platform to visualise, analyse, and act on their air quality data, from a single sensor to a city-wide network.
✓ One-stop air quality data visualisation and analysis.
✓ Sophisticated graphing tools and comparison features.
✓ All data is authenticated, stored, and backed up on the Persium cloud.
✓ Extended AI-driven prediction forecasts.


The Persium Dashboard Advantage

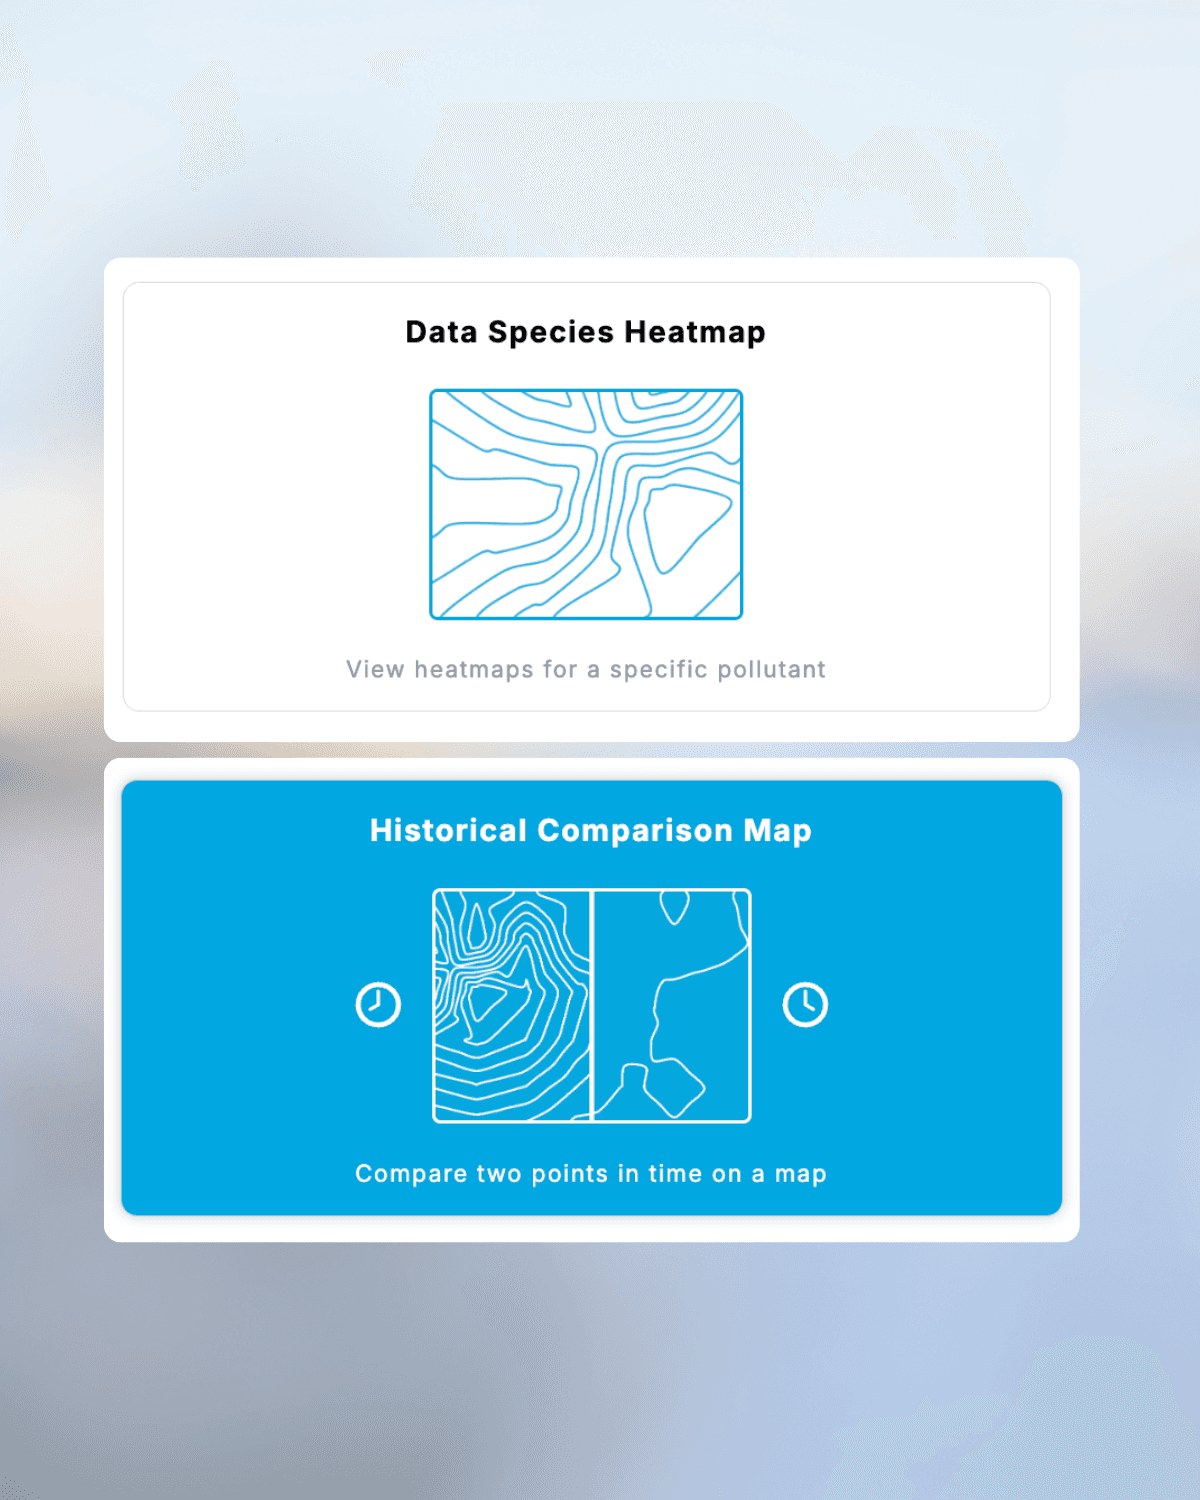
Heatmaps and Isobar Visualisation
Heatmaps and Isobar Visualisation
Track how pollution moves over time with historic heatmaps and isobar animations built directly into the Dashboard.
Track how pollution moves over time with historic heatmaps and isobar animations built directly into the Dashboard.
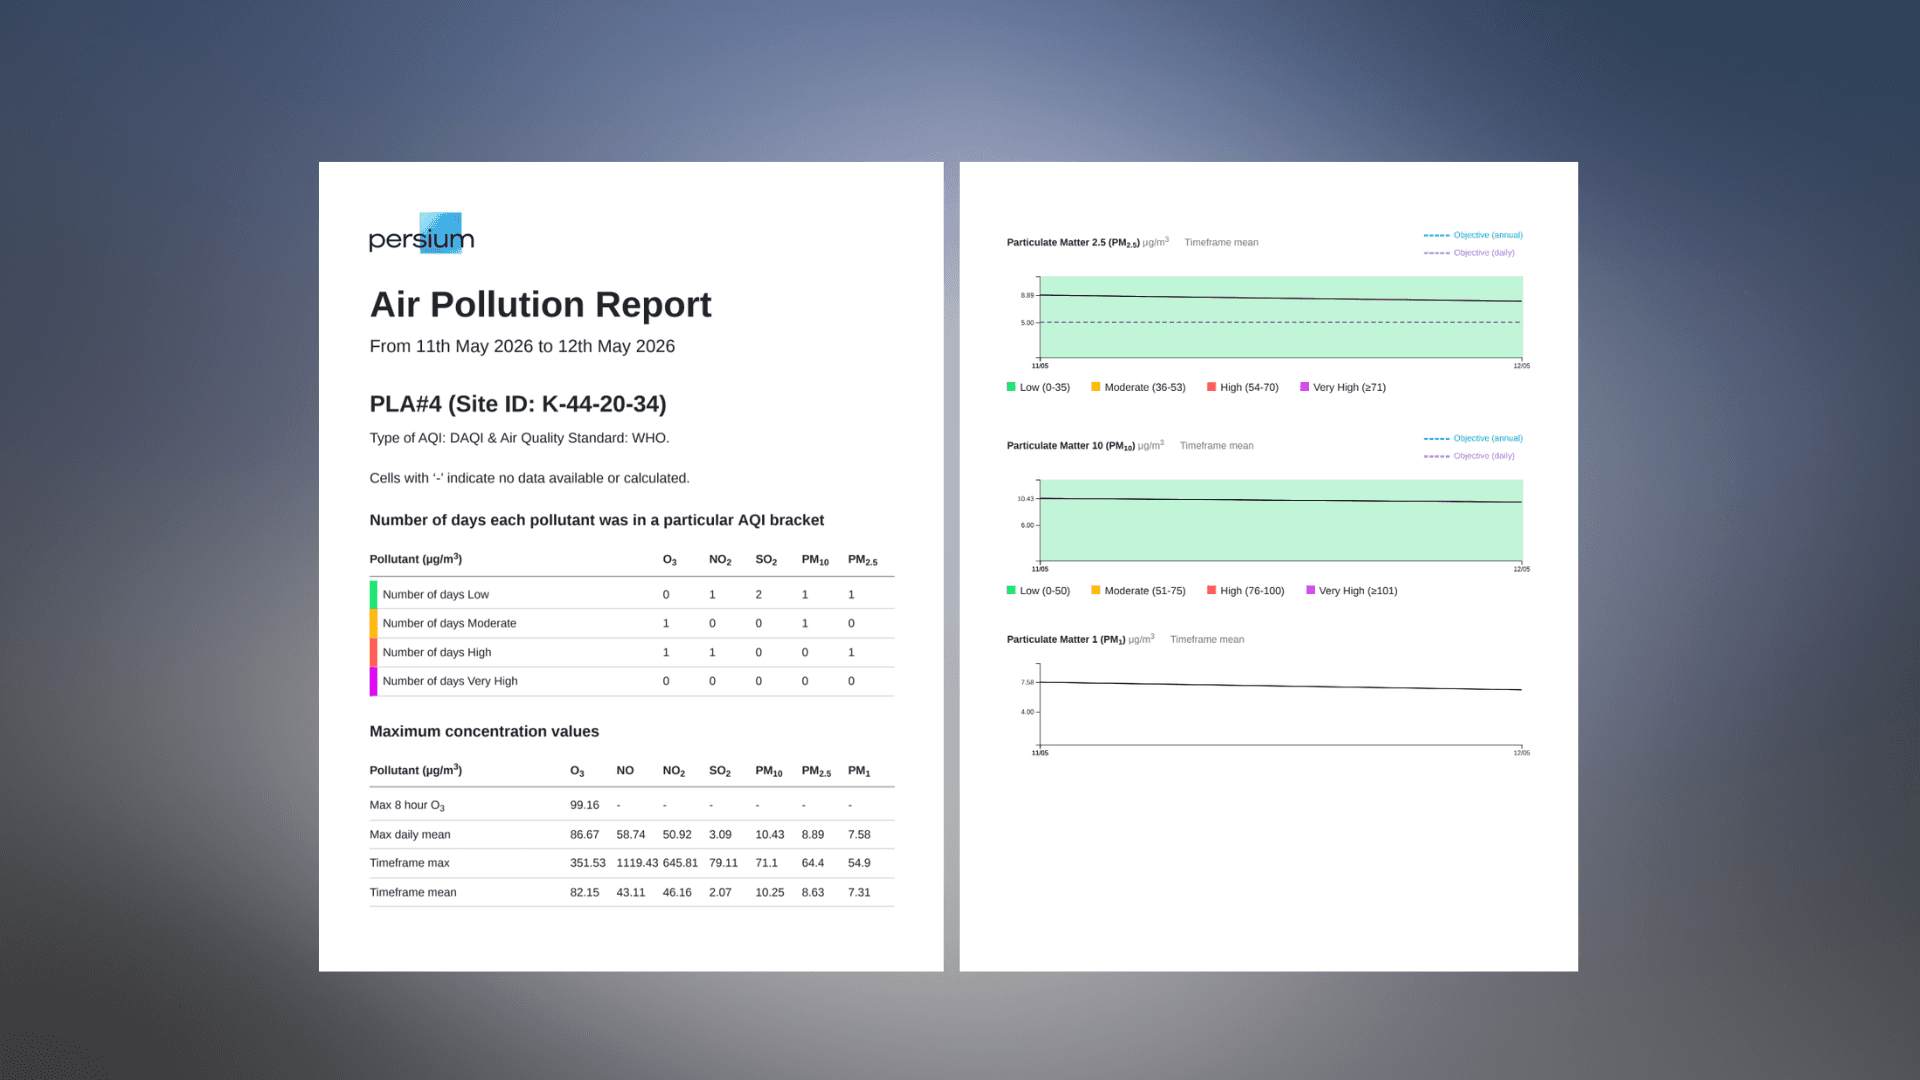
Customisable Dashboard & Reports
Customisable Dashboard & Reports
Build your dashboard around the metrics that matter and generate shareable reports in minutes.

Deep Pollutant Insights
Deep Pollutant Insights
Track dominant pollutants, pollution trends, and best and worst air quality results across your sensor network.
Track dominant pollutants, pollution trends, and best and worst air quality results across your sensor network.

Secure Data Infrastructure
Secure Data Infrastructure
Connect your existing network of air quality sensors via API and view all your data in one place.

Customisable Dashboard & Reports
Build your dashboard around the metrics that matter and generate shareable reports in minutes.
Secure Data Infrastructure
Connect your existing network of air quality sensors via API and view all your data in one place.
Built for every organisation that needs to understand its environment, demonstrate progress, and share the evidence, clearly and confidently.
Dashboard Application
Use Case
ESG & Sustainability Teams
Facility & Building Managers
Local Authorities & Policymakers
Turn real-time air quality data into defensible evidence for clean air zones, planning applications, and public health reporting. Share live dashboards with communities and demonstrate measurable progress on air quality commitments.

Monitor indoor and outdoor conditions across your entire portfolio from one platform. Identify problem areas before they become complaints, maintain LEED performance records, and give occupants confidence in the air they breathe.

Researchers & Consultants
Access clean, continuous, time-stamped datasets across your entire sensor network. Export via CSV or API, correlate across locations and timeframes, and build the evidence base your studies and reports demand.
Move beyond estimates and self-reported metrics. Continuous, auditable air quality data gives your ESG reporting the measured environmental performance that investors, regulators, and stakeholders increasingly expect.

Industrial & Site Operators
Track emissions at source across complex sites — from boundary monitoring to worker exposure. Respond to fugitive emission events in real time and maintain a documented record of environmental performance for compliance and audit purposes.
Use Case
Dashboard Application
Dashboard Application
Built for every organisation that needs to understand its environment, demonstrate progress, and share the evidence, clearly and confidently.
Local Authorities & Policymakers
Turn real-time air quality data into defensible evidence for clean air zones, planning applications, and public health reporting. Share live dashboards with communities and demonstrate measurable progress on air quality commitments.
Facility & Building Managers
Monitor indoor and outdoor conditions across your entire portfolio from one platform. Identify problem areas before they become complaints, maintain LEED performance records, and give occupants confidence in the air they breathe.
Researchers & Consultants
Access clean, continuous, time-stamped datasets across your entire sensor network. Export via CSV or API, correlate across locations and timeframes, and build the evidence base your studies and reports demand.
ESG & Sustainability Teams
Move beyond estimates and self-reported metrics. Continuous, auditable air quality data gives your ESG reporting the measured environmental performance that investors, regulators, and stakeholders increasingly expect.
Industrial & Site Operators
Track emissions at source across complex sites — from boundary monitoring to worker exposure. Respond to fugitive emission events in real time and maintain a documented record of environmental performance for compliance and audit purposes.