
Introduction: Why 2026 is a turning poiny for smart city air quality
By 2026, air quality monitoring in smart cities has moved well beyond pilot projects and isolated sensors. Cities are now expected to operate continuous, city-scale monitoring networks that inform transport policy, public health, planning, and climate resilience.
This shift is driven by tighter regulation, growing public awareness, and the reality that air pollution is a hyperlocal, dynamic problem. Background monitoring stations alone can no longer capture how exposure changes street by street, hour by hour. As a result, cities are investing in dense sensor networks, but many still struggle to turn data into decisions.
This guide draws on practical lessons from large-scale deployments to explain how modern air quality monitoring networks are designed, operated, and used effectively in 2026.
What Defines a Large-Scale Air Quality Monitoring Network?
A large-scale air quality network is not defined by the number of sensors alone. In practice, scale comes from three elements:
Introduction: Why 2026 is a Turning Point for Smart City Air Quality
By 2026, air quality monitoring in smart cities has moved well beyond pilot projects and isolated sensors. Cities are now expected to operate continuous, city-scale monitoring networks that inform transport policy, public health, planning, and climate resilience.
This shift is driven by tighter regulation, growing public awareness, and the reality that air pollution is a hyperlocal, dynamic problem. Background monitoring stations alone can no longer capture how exposure changes street by street, hour by hour. As a result, cities are investing in dense sensor networks, but many still struggle to turn data into decisions.
This guide draws on practical lessons from large-scale deployments to explain how modern air quality monitoring networks are designed, operated, and used effectively in 2026.
Coverage: Capturing conditions across streets, neighbourhoods, transport corridors, buildings, and communities.
Continuity: Collecting data continuously over months and years, not short campaigns.
Context: Understanding how pollution moves, changes, and affects people in real environments.
Traditional reference-grade stations remain essential for calibration and regulatory baselines. However, on their own they cannot explain local exposure, policy impacts, or short-lived pollution events. Modern networks combine reference stations with dense, distributed sensors to reveal patterns that were previously invisible.
What Pollutants Matter Most in Smart Cities (2026)
Large-scale networks are increasingly pollutant-specific by design, with different measurements serving different decisions.
Particulate Matter (PM2.5, PM10)
Still the most important indicators for population exposure, traffic emissions, construction activity, and wildfire smoke.
Nitrogen Dioxide (NO₂)
A critical pollutant for traffic management, Clean Air Zones, and regulatory compliance, especially at roadsides and junctions.
Carbon Dioxide (CO₂ – Indoors)
Used as a proxy for ventilation and occupancy, increasingly monitored in schools, offices, and public buildings.
Volatile Organic Compounds (VOCs)
Relevant for indoor environments, campuses, laboratories, and areas with industrial or commercial activity.
Ultrafine Particles (PM0.3 / PM0.1)
An emerging priority in 2026, particularly near roads, airports, and ports, where health impacts are increasingly recognised.
Environmental Context
Temperature, humidity, and wind provide context to pollutant levels, understand dispersion, & explain pollution behavior.
Network Design: Density, Placement, and Coverage
One of the most common mistakes in large-scale projects is underestimating sensor density. A single sensor per district rarely reflects real exposure, especially in cities where air quality can change street by street and building by building.
In practice, effective networks prioritise use-case–driven placement, for example:
Roadside and junction monitoring to capture traffic-related pollution and congestion hotspots
Boundary monitoring near construction sites, industrial areas, ports, and major infrastructure
Community-level sensors in residential neighbourhoods to understand everyday exposure
Strategic indoor monitoring in schools, universities, shopping centres, offices, and hospitals, where people spend long periods indoors
Transport hubs such as airports and stations, where emissions, occupancy, and airflow interact in complex ways
Placement is guided by urban form, prevailing wind patterns, land use, and human activity, not convenience alone. By 2026, leading cities are designing air quality networks around how spaces are actually used, rather than administrative boundaries on a map.
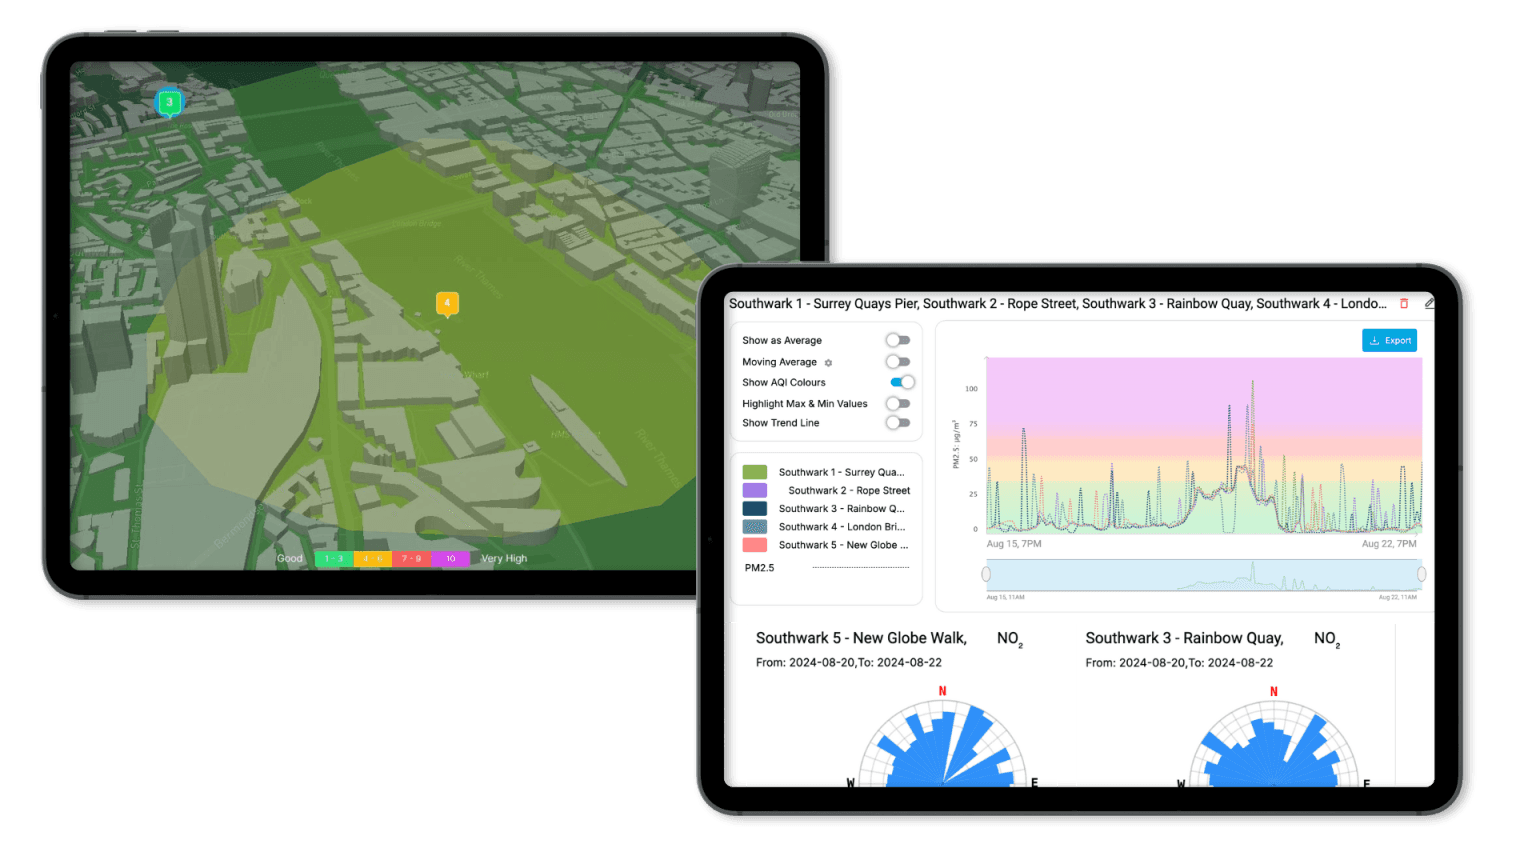
From Data to Decision: Dashboards, Maps and Digital Twins
Collecting data at scale only creates value when it can be understood and acted upon.
In 2026, effective air quality platforms prioritise:
Spatial heatmaps to reveal patterns and hotspots
Time-series analysis to understand trends and daily cycles
Comparative views to evaluate interventions
Digital twin environments to test scenarios and communicate impact
Clear visualisation allows planners, transport teams, public health officials, and policymakers to work from a shared evidence base, rather than isolated datasets.
Operating Networks at Scale: The Practical Reality
At small scale, air quality monitoring can rely on individual sensors and isolated datasets. At city scale, this breaks down. Large networks behave as systems, where weaknesses in sensors, data flow, or interpretation quickly compound.
By 2026, successful large-scale networks share a few defining characteristics:
Reliable sensor data at scale, where measurements remain consistent across locations and over time
Coverage designed around use cases: roads and junctions for traffic; boundaries for projects and industry; sensitive receptors like schools, hospitals, airports, and dense commercial spaces.
Environmental context: wind and local conditions materially change interpretation, especially for dispersion, hotspots, and source behaviour.
Unified data layer: one system for ingestion, storage, and access so the network behaves like a single instrument, not fragmented devices and dashboards.
Decision-readiness: data must be structured to support practical questions—before/after policy changes, identifying hotspots, tracking trends, and prioritising interventions.
Scalability without complexity: adding sensors should increase insight, not increase operational burden or create multiple disconnected datasets.
The Persium Approach: Designing Air Quality Networks That Actually Drive Change
Persium provides a complete air quality monitoring system that connects outdoor pollution, indoor exposure, and urban decision-making in one platform. By combining scalable sensing hardware with live dashboards and map-based visualisation, Persium enables cities, building owners, and infrastructure operators to monitor air quality continuously, understand exposure in real environments, and take evidence-based action at scale.
The Persium Air Quality and Environmental System
Persium Outdoor Pods: Compact air quality sensors designed for continuous outdoor monitoring of pollutants such as PM and NO₂ across streets, roadsides, construction sites, ports, and transport corridors.
Persium Indoor Pods: Indoor air quality sensors measuring CO₂, particulate matter, VOCs, temperature, and humidity, supporting healthier, better-ventilated schools, offices, and public buildings.
Persium Dashboard: A single platform for real-time data, trends, alerts, and reporting—supporting compliance, operations, and long-term planning.
Persium Mapview: Live maps and heatmaps that show how air quality changes across locations, helping users identify hotspots, compare areas, and assess impact.