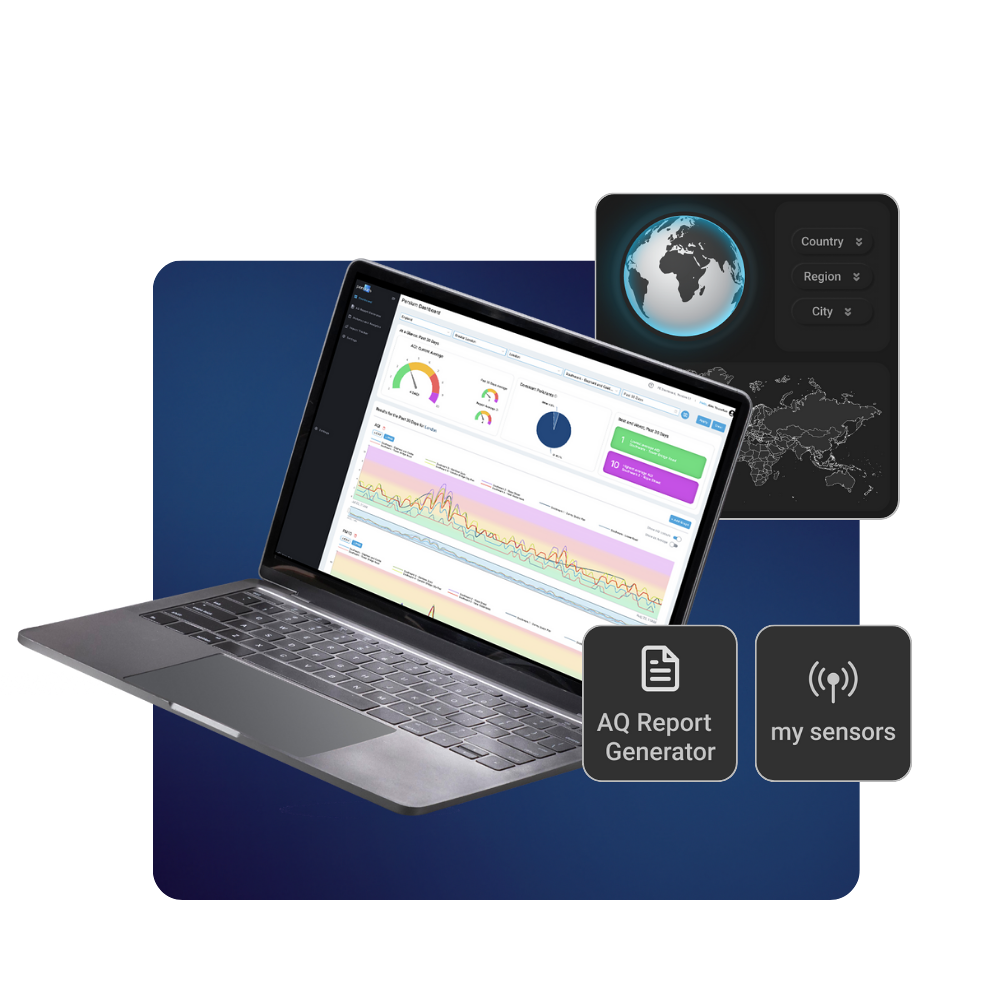

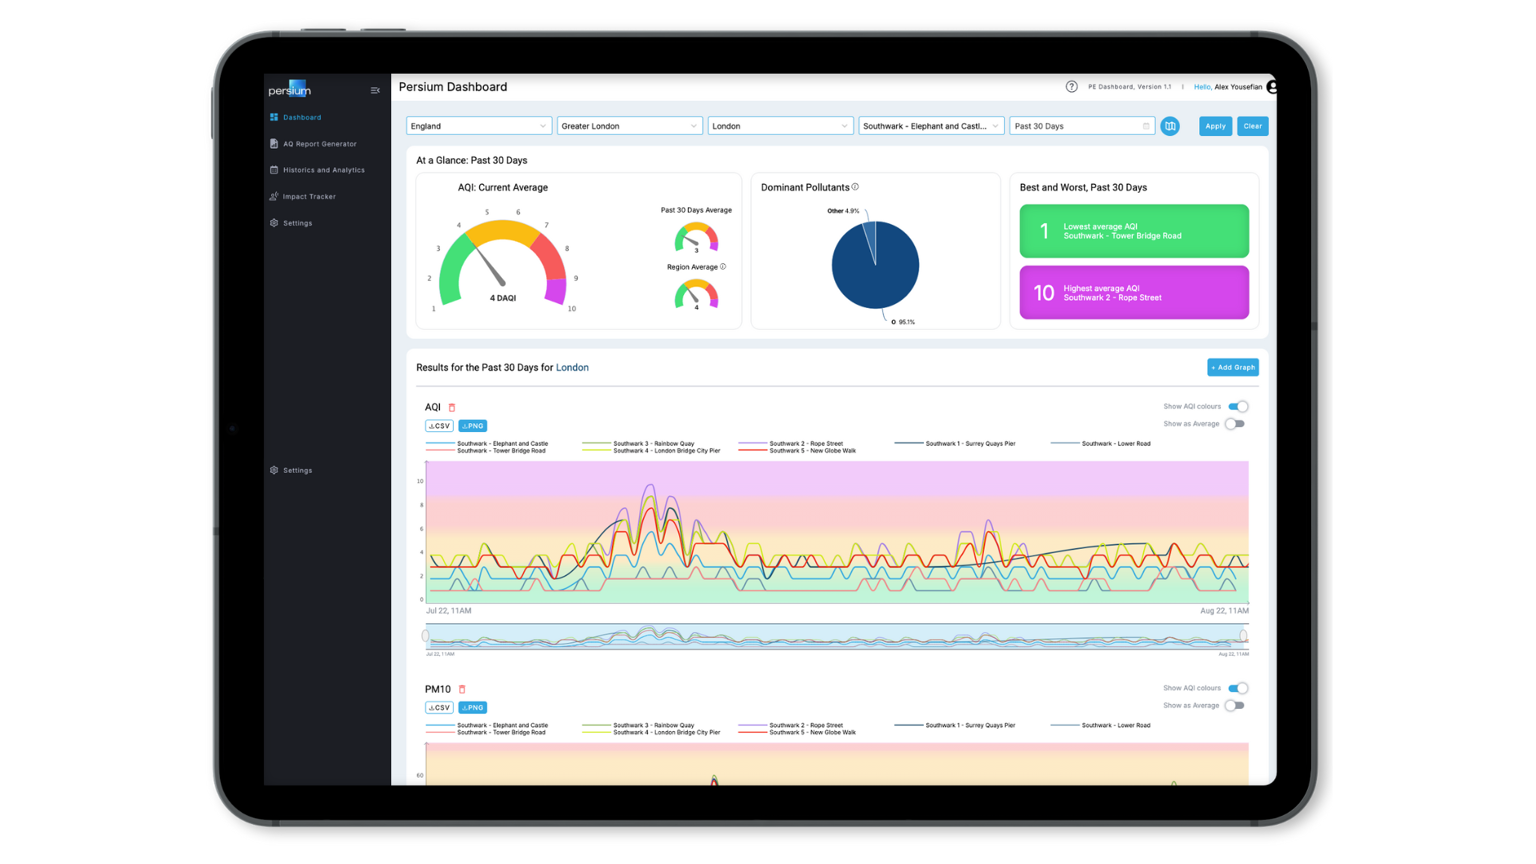
Persium Dashboard
✓ One-stop air quality data visualisation, analysis, and management web application.
✓ Sophisticated graphing tools and comparison features.
✓ All data is authenticated, stored, and backed up on the Persium cloud.
✓ Extended AI-driven prediction forecasts.
What makes the Dashboard the most
comprehensive Air Quality tool?
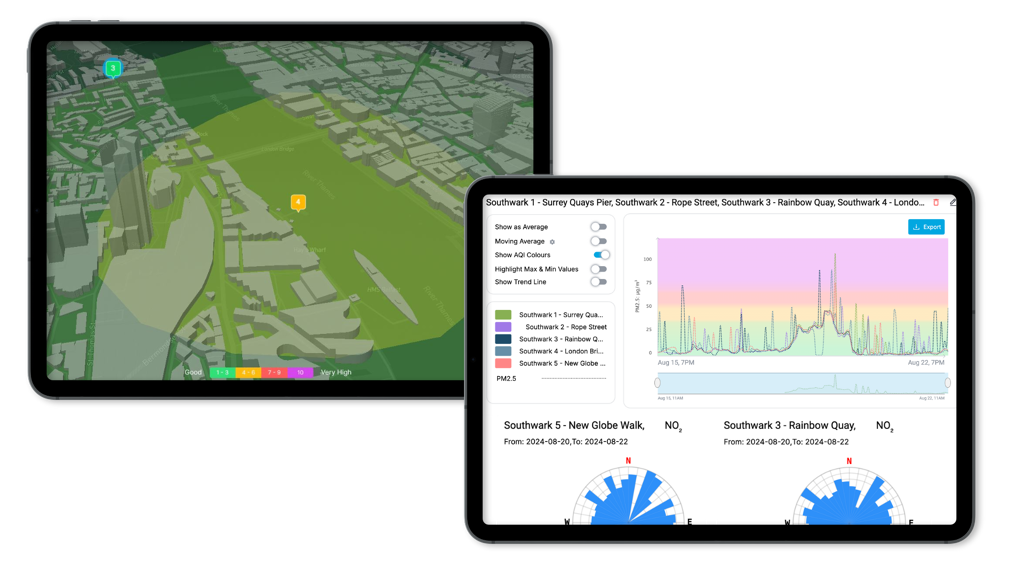
✓ Our inbuilt MapView® functionality creates historic heatmaps and isobar videos to compare pollution movement over given time period.
✓ Customise your dashboard and generate reports in minutes.
✓ Examine key customisable metrics such as dominant pollutants, pollution trends, and best and worst air quality results for selected sensors.
✓ Easily integrate your current network of air quality sensors through an API into the Persium Dashboard to view their data.
Get In Touch With Our Team
With our hardware and software air quality monitoring services and capabilities, we can easily provide consultation and demos for all air quality monitoring needs.
Get In Touch With Our Team
With our hardware and software air quality monitoring services and capabilities, we can easily provide consultation and demos for all air quality monitoring needs.
Explore how the Persium Dashboard empowers
policymakers in air quality monitoring.
Let’s discuss.